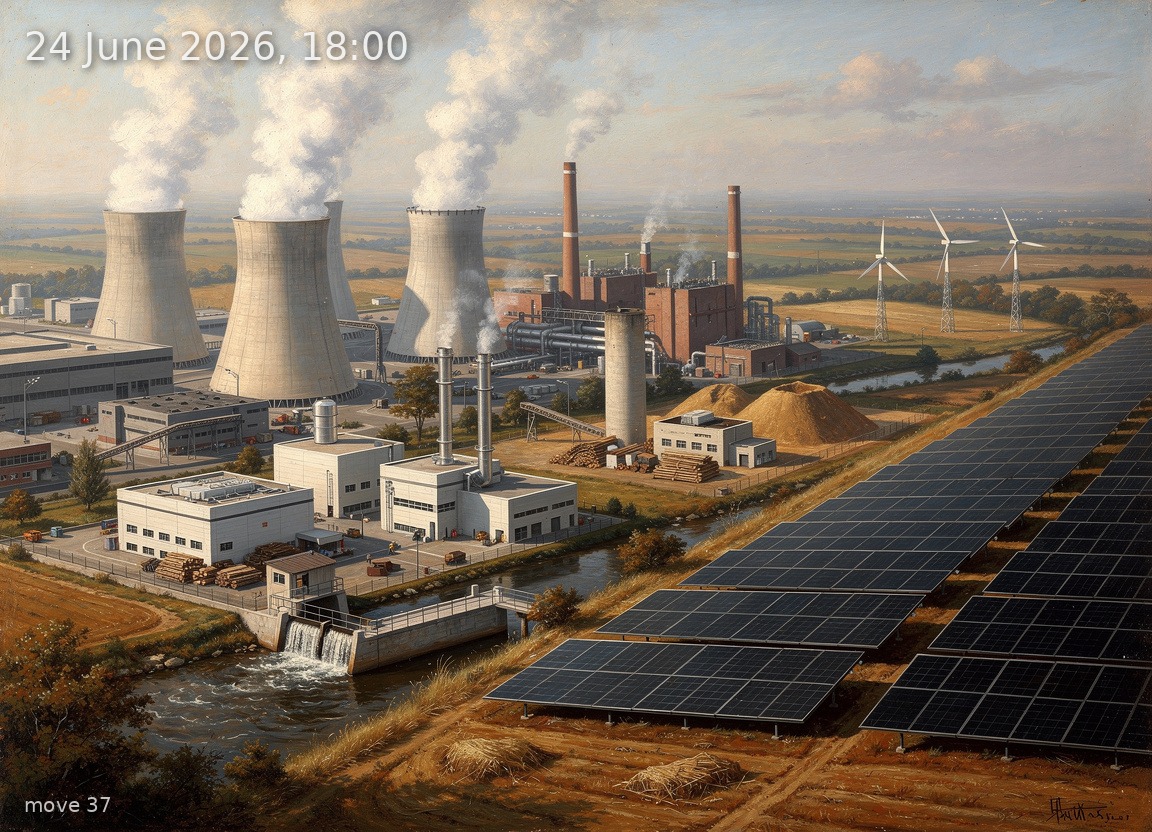
Solar leads at 20 GW but 14.8 GW net imports are needed as heat drives 58.3 GW demand with negligible wind.
Back
Generation mix
Wind onshore 2%
Wind offshore 1%
Solar 46%
Biomass 9%
Hydro 4%
Natural gas 11%
Hard coal 8%
Brown coal 19%
62%
Renewable share
1.3 GW
Wind (on + offshore)
20.0 GW
Solar
43.5 GW
Total generation
-14.8 GW
Net import
196.8 €/MWh
Day-ahead price
32.5°C / 7 km/h
Temp / Wind speed
Open-Meteo, Kassel (51.3°N 9.5°E)
3.0% / 414.0 W/m²
Cloud cover / Radiation
271
gCO₂/kWh
Image prompt
Solar 20.0 GW dominates the right half of the canvas as vast fields of aluminium-framed crystalline silicon photovoltaic panels stretching across parched golden-brown farmland under blazing late-afternoon sun; brown coal 8.2 GW occupies the left quarter as a massive lignite power station complex with four hyperbolic concrete cooling towers trailing thick white steam plumes into the hazy sky; natural gas 4.7 GW appears centre-left as two compact CCGT blocks with slender silver exhaust stacks venting heat shimmer; hard coal 3.7 GW sits behind the gas plant as a pair of older boiler houses with tall square chimneys; biomass 3.8 GW is rendered as a mid-ground wood-chip-fed CHP plant with a stumpy cylindrical stack and timber storage yard; hydro 1.8 GW appears as a concrete weir and small run-of-river powerhouse beside a low, heat-sluggish river in the middle distance; wind onshore 1.0 GW is a small cluster of three nearly motionless three-blade turbines on lattice towers far in the background, blades barely turning; wind offshore 0.2 GW is a single faint turbine silhouette on the extreme horizon. The time is 18:00 in late June: the sun hangs roughly 25 degrees above the western horizon, casting long warm amber-orange shadows across the landscape, the sky a deep, oppressive brassy blue overhead fading to a hot white-gold haze at the horizon suggesting extreme heat. Vegetation is summer-green but stressed and wilting, dry grass between the solar rows, heat shimmer rising from asphalt roads. The atmosphere feels heavy and stifling, suggesting the high electricity price — a thick, leaden quality to the air, cumulus barely forming in the motionless heat. Highly detailed oil painting in the tradition of 19th-century German Romantic landscape painting — rich saturated colour, visible confident brushwork, atmospheric perspective with haze layering the distance, dramatic chiaroscuro from the low western sun — yet every piece of energy infrastructure rendered with meticulous engineering accuracy: turbine nacelles, PV cell grid patterns, cooling tower parabolic profiles, CCGT stainless-steel exhaust cowls. No text, no labels.