
242
~380
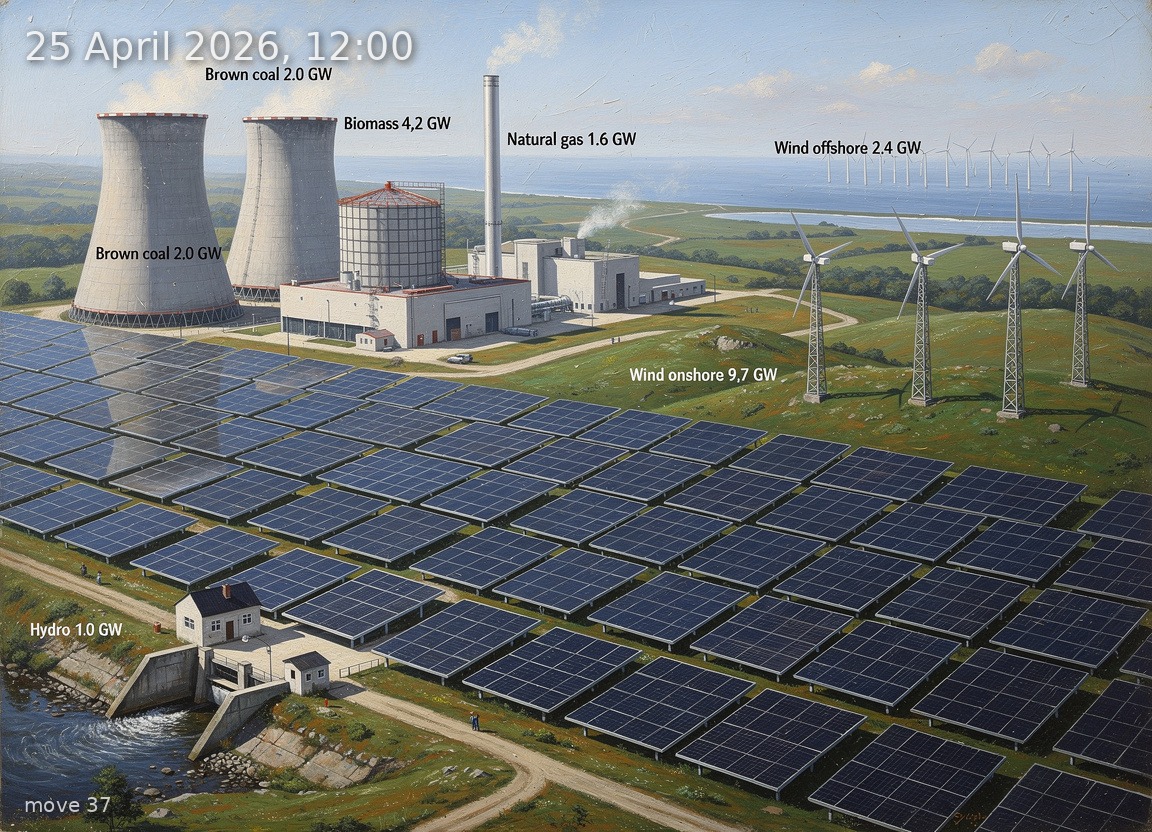
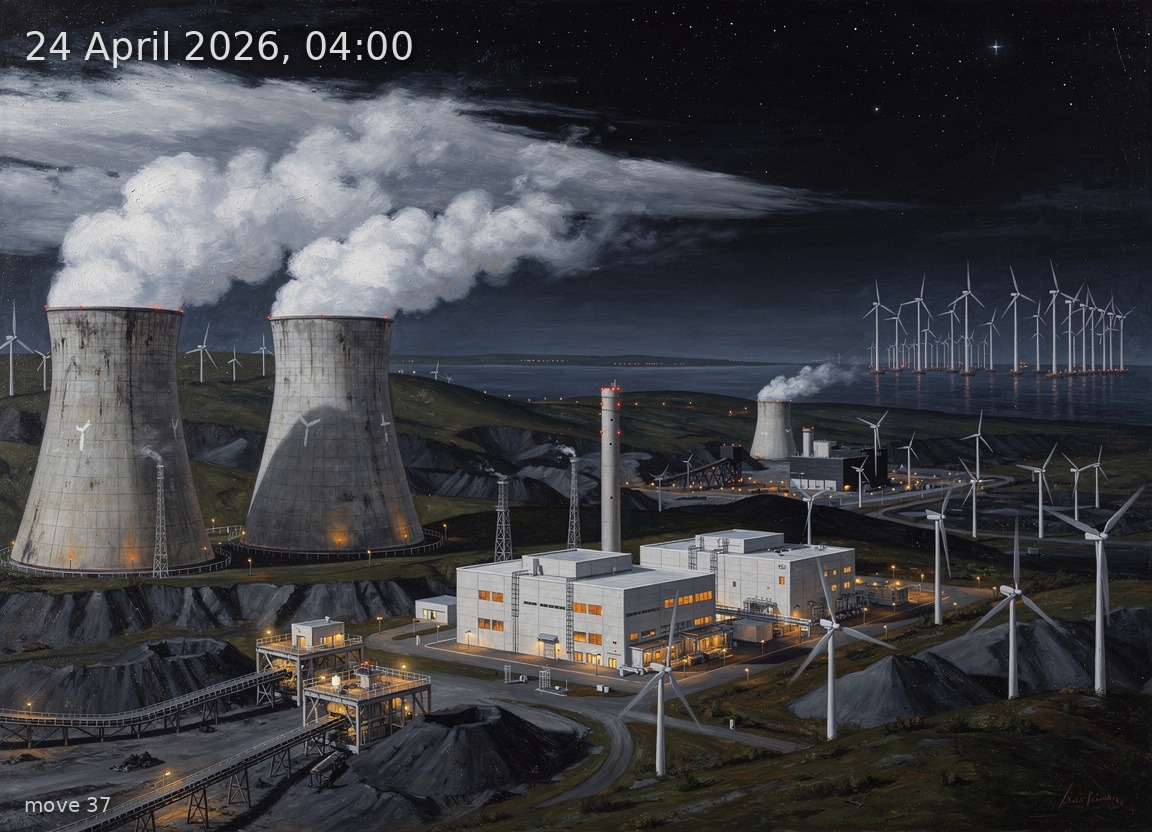
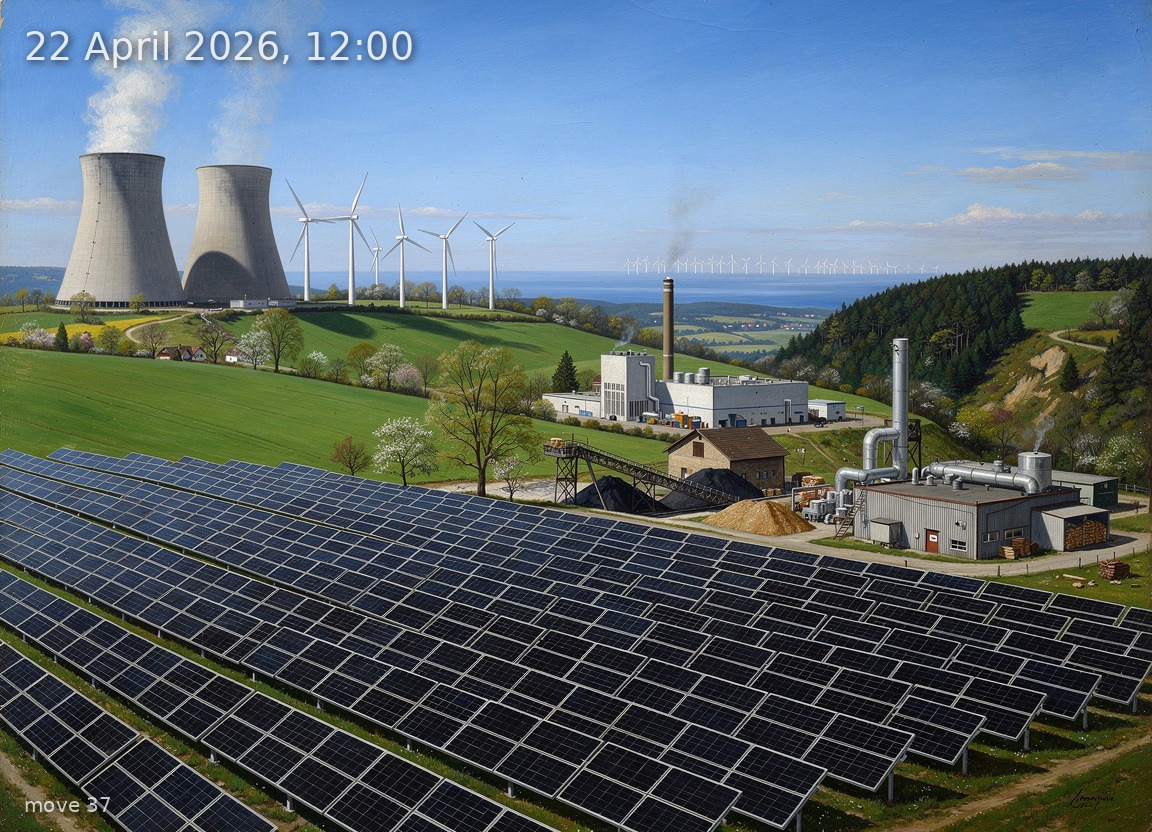
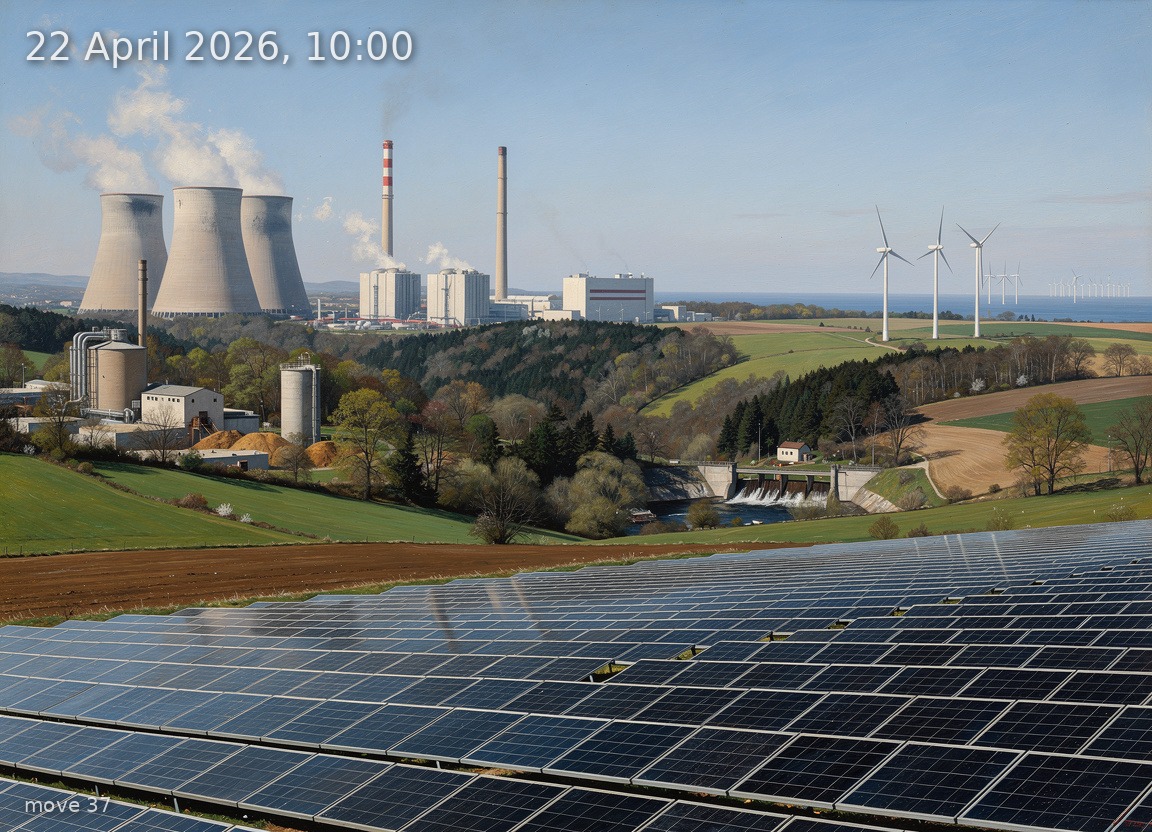
Residual load = consumption − wind − solar. It is the net demand that dispatchable
plants — coal, gas, biomass, hydro, storage — plus cross-border exchanges must balance.
When it is high, expensive thermal capacity is needed and prices rise with it.
As residual load falls, wind and solar displace more thermal generation, pulling prices down.
When it turns negative, wind and solar output alone exceeds all consumption:
controllable plants ramp to their technical minimums, storage absorbs what it can,
and the grid exports heavily — often with prices turning negative too.
Forecast (dashed): tomorrow's predicted DA price (P50 median) with P10–P90
uncertainty band. Full forecast →
EUR/MWh. GB: system price in GBP (balancing, not DA auction). Source: Energy-Charts, Elexon. Full markets dashboard →


30 days of grid data as a 3D star map. Each star = one hour. Drag to rotate, scroll to zoom.