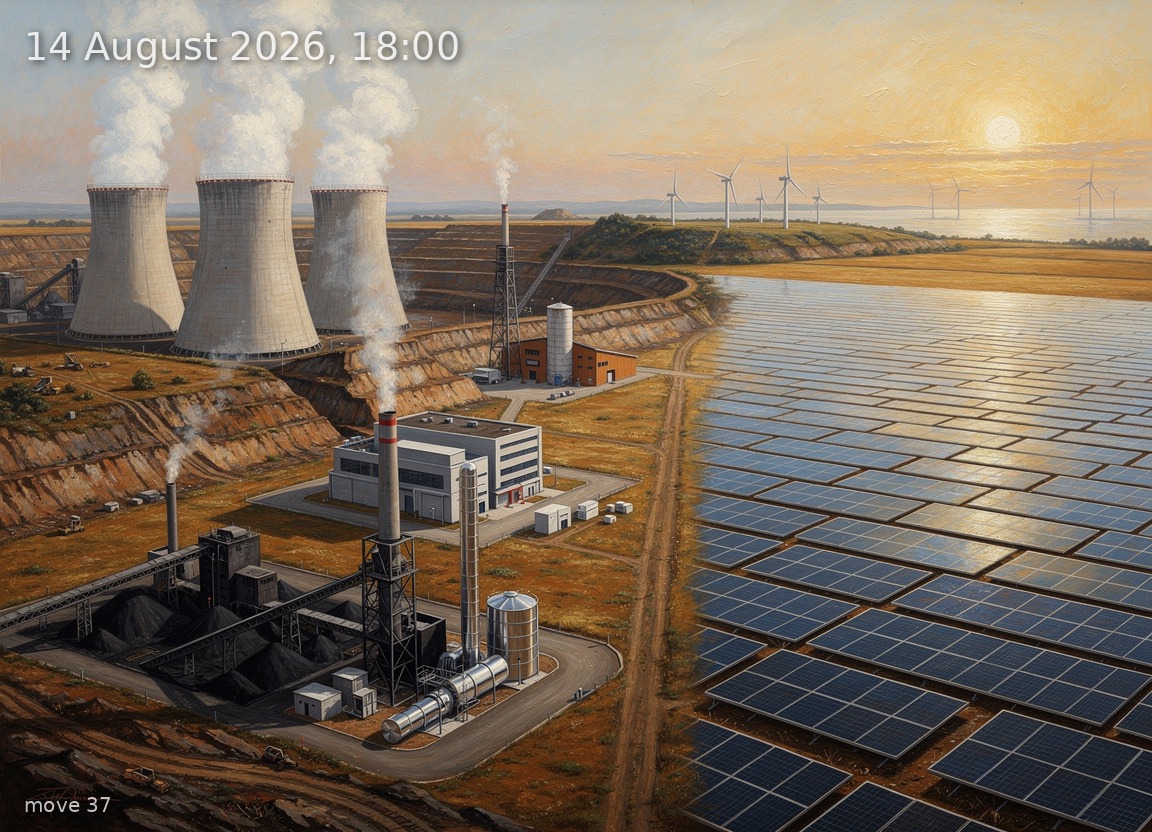
Solar leads at 16.9 GW but extreme heat drives 53.8 GW demand, requiring 13.9 GW net imports and heavy coal dispatch.
Generation mix
Wind onshore 6%
Wind offshore 3%
Solar 42%
Biomass 9%
Hydro 3%
Natural gas 9%
Hard coal 11%
Brown coal 16%
63%
Renewable share
3.4 GW
Wind (on + offshore)
16.9 GW
Solar
39.9 GW
Total generation
13.9 GW
Net import
180.0 EUR/MWh
Day-ahead price
34.8°C / 9 km/h
Temp / Wind speed
Open-Meteo, Kassel (51.3°N 9.5°E) · surface estimate from 100 m wind
0.0% / 366.0 W/m²
Cloud cover / Radiation
265
gCO₂/kWh
Image prompt
Solar 16.9 GW dominates the right half of the scene as vast fields of aluminium-framed crystalline silicon photovoltaic panels stretching across scorched golden-brown farmland, angled toward a fierce low sun. Brown coal 6.5 GW occupies the left foreground as three massive hyperbolic cooling towers with thick white steam plumes rising into the hazy sky, adjacent to open-pit lignite mines with terraced brown earth. Hard coal 4.5 GW appears just right of the cooling towers as a dark industrial complex with conveyor belts, coal bunkers, and twin chimneys trailing grey smoke. Natural gas 3.8 GW is rendered as a compact CCGT facility with polished exhaust stacks and a single smaller cooling tower in the centre-left middle ground. Biomass 3.7 GW appears as a modest wood-clad generating station with a tall cylindrical silo and thin white exhaust, positioned behind the gas plant. Wind onshore 2.4 GW is shown as a small cluster of three-blade turbines on a distant ridge at centre-right, their blades barely turning in the still air. Wind offshore 1.0 GW is suggested by two or three turbines visible on the far horizon line. Hydro 1.1 GW appears as a small dam and reservoir tucked into a valley at the far left edge. The lighting is late dusk at 18:00 in August: the sun sits low on the right horizon casting long amber-orange light across the landscape, the upper sky transitioning from pale blue to warm gold near the horizon, with absolutely zero clouds — a completely clear, oppressive, heatwave sky. The atmosphere feels heavy, thick, and shimmering with heat haze; the vegetation is parched summer grass, wilted crops, and dusty deciduous trees with dark green foliage drooping in the heat. High-voltage transmission pylons march across the middle ground carrying power lines that seem to hum with the strain of 180 EUR/MWh prices. The overall mood is oppressive industrial grandeur under relentless summer heat. Rendered as a highly detailed oil painting in the tradition of 19th-century German Romantic landscape painters — rich saturated colour, visible impasto brushwork, atmospheric perspective with haze softening the distant elements — but with meticulous engineering accuracy in every turbine nacelle, every PV cell reflection, every cooling tower's parabolic curve. No text, no labels.